LogicMesh Tools
Retail demand forecasting made legible—charts, signals, and planning habits that hold up when shelves move fast.
Featured programmes
Courses built around live retail rhythms
Each programme pairs visual analytics with demand scenarios drawn from grocery, fashion, and specialty retail.

From the floor
“The promo module stopped us from double-counting festival lift.”
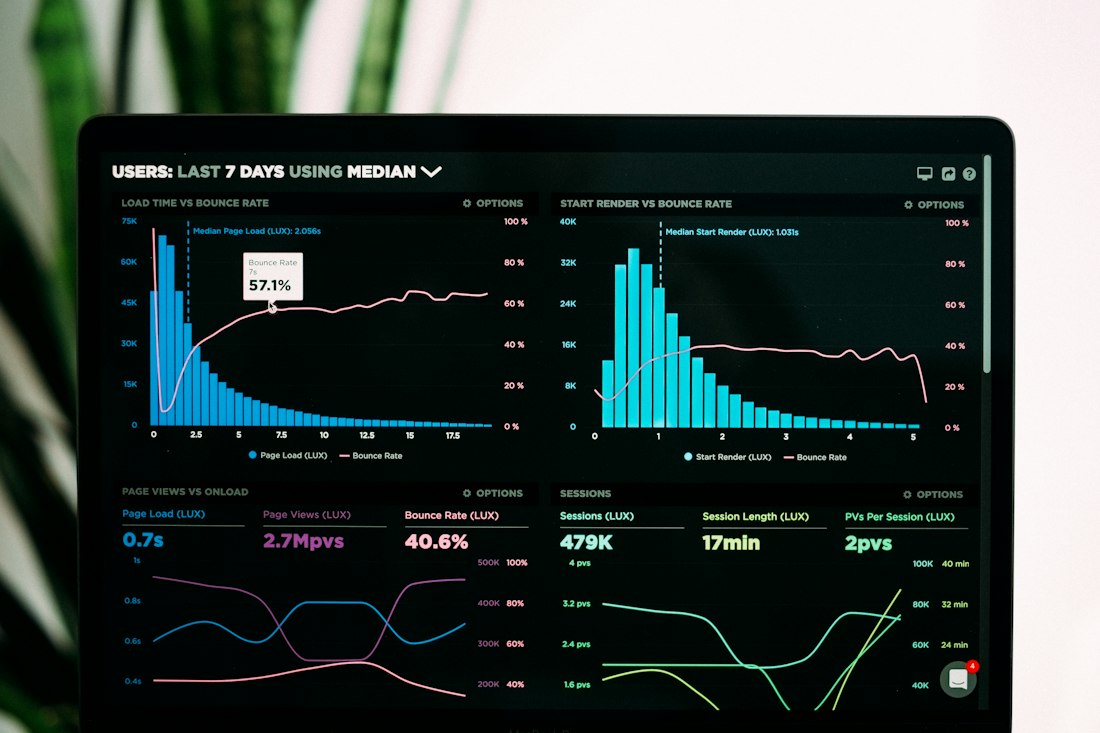
We used the Promo Lift Visuals exercises on our Hari Raya assortment. The charts made overlapping campaigns obvious—something our old spreadsheet never surfaced. Setup still took longer than the brochure suggested, but the payoff showed in the second cycle.
Why teams stay
Benefits that show up in the planning meeting
Visual habits, not tool trivia
We teach annotation, baseline comparison, and exception views—skills that transfer when your BI stack changes.
Malaysia-aware scenarios
Festival calendars, monsoon seasonality, and multi-format store networks appear in labs—not as an afterthought.
Honest limits
When a dataset cannot support a forecast claim, we train you to say so clearly instead of decorating the gap.
Ready to mesh your demand signals?
Start with Retail Forecast Studio or ask us which path fits your assortment and team size.